Pie Chart Maker: Make a Pie or Donut Chart and Download It as PNG or SVG
This pie chart maker turns a list of labels and numbers into a pie chart that updates as you type. Each slice shows its percentage, a legend with the labels is drawn into the image, and you can Download PNG or Download SVG when it looks right. It runs in your browser, with no account and no watermark.
How to Make a Pie Chart
- Look at the chart preview at the top. It starts with four sample rows (Pizza 40, Burgers 25, Salad 20, Tacos 15), so you can see how it works straight away.
- Type a Chart title if you want one. It is optional and holds up to 60 characters.
- Replace the sample text in the Label and Value boxes with your own. A label holds up to 40 characters, and a value is a number, zero or more.
- Select Add row for another slice, up to 30 rows. Select the X on a row to remove it. At least one row always stays.
- Select Download PNG or Download SVG, directly under the preview.
The preview always has a white background, so it looks like the file you download. Slices start at 12 o'clock and go clockwise in the order of your rows.
Total: 30
Slices: Yes 60%, No 23.3%, Not sure 16.7%
How Pie Chart Percentages Are Calculated
A slice's size is its value divided by the total of all the values, so the numbers you enter do not need to add up to 100. Entering 12, 30 and 18 gives a total of 60 and slices of 20%, 50% and 30%. Percentages show with one decimal when they are not whole, such as 23.3%.
With Show percentages on, which is the default, the percentage is written on every slice of 5% or more, and beside every entry in the legend. Smaller slices are left unlabeled on the pie so the text does not crowd, but their percentage is still in the legend. Turn the option off to draw the chart with no percentages at all.
Make a Donut Chart
Select Customize to open the options, then tick Donut chart. The same data is drawn with a hollow centre, with the percentages on the ring. Untick it for a full pie.
Pie Chart Color Palettes, Including Colorblind-Safe
Under Color palette, choose Standard, Vibrant, Monochrome or Colorblind-safe. Slices take the palette's colors in row order. Monochrome spreads one blue from dark to light, which suits a black-and-white printout. Colorblind-safe uses the Okabe-Ito colors, designed to stay distinct for the common kinds of color blindness. You pick the palette, not the color of each slice.
Download as PNG or SVG
Download PNG saves a 1200 px wide image on a white background, which is a good fit for slides, documents and posts. Download SVG saves a vector file that stays sharp at any size and opens in design software for further editing. Both contain the title, the pie, the percentages and the legend, so the labels travel with the chart.
What Is Not Drawn
- A row with an empty value is skipped without a message.
- A value of 0 is accepted but has no slice and no legend entry.
- A value that is text or negative is not drawn, and a message under the table says how many rows were left out.
- A row with an empty label is named after its row number, for example Slice 3.
- A label too long for the legend is shortened with an ellipsis in the image.
Either 1,5 or 1.5 is read as one and a half.
Frequently Asked Questions
How do I make a pie chart with percentages?
Type a label and a value in each row and the percentages appear by themselves. Each slice is its value divided by the total of all values, and Show percentages is on by default, so every legend entry shows its percentage and slices of 5% or more carry it too. You never enter the percentages yourself.
Is there a free pie chart maker with no sign up?
Yes. This one needs no account and no email. Enter your labels and values, then select Download PNG or Download SVG. The file has no watermark, and your data stays in your browser.
How do I download a pie chart as a PNG or SVG?
Select Download PNG for a 1200 px wide image on a white background, ready for slides, documents and social posts. Select Download SVG for a vector file you can scale to any size and edit in design software. Both include the title, the legend and the percentages.
How do I make a donut chart?
Open Customize and tick Donut chart. The same data is drawn with a hollow centre, and percentages move onto the ring. Untick it to go back to a full pie. The PNG and SVG downloads follow whatever the preview shows.
How do I calculate pie chart percentages?
Divide each value by the total of all values and multiply by 100. For 12, 30 and 18 the total is 60, so the slices are 20%, 50% and 30%, which take 72, 180 and 108 degrees of the circle. The tool does this as you type, so the values do not need to add up to 100.
Can I make a pie chart from data I already have?
Yes. Type or paste each label and number into the Label and Value boxes of a row, and select Add row for more, up to 30 rows. A value can be a whole number, a decimal or a count, and either 1,5 or 1.5 is read correctly. There is no file import, so enter the rows by hand.
Is there a colorblind-safe pie chart palette?
Yes. Open Customize and choose Colorblind-safe under Color palette. It uses the Okabe-Ito set, a standard palette chosen to stay distinguishable for the common kinds of color blindness. Monochrome is another option when the chart will be printed in black and white.
Can I make a pie chart for a survey or poll?
Yes. Use each answer as a label and the number of votes as its value, for example Yes 18, No 7, Not sure 5. You can enter raw counts instead of percentages, and the tool turns them into percentages for the chart and legend.
Does the pie chart include a legend?
Yes. The legend is drawn into the image, with a color swatch, the label and the percentage for each slice, so the PNG and SVG are readable on their own. With more than 6 slices the legend splits into two columns, and a label that is too long is shortened with an ellipsis.
Can I choose the color of each slice?
No. You choose one of four palettes, Standard, Vibrant, Monochrome or Colorblind-safe, and slices take its colors in row order. Reorder the rows by retyping them if you want a different slice to get a particular color.
Is my data uploaded anywhere?
No. The chart is drawn and exported in your browser, and nothing you type is sent to a server. There is no account to create and no cloud save, so closing the page clears the chart.
Recommended
-
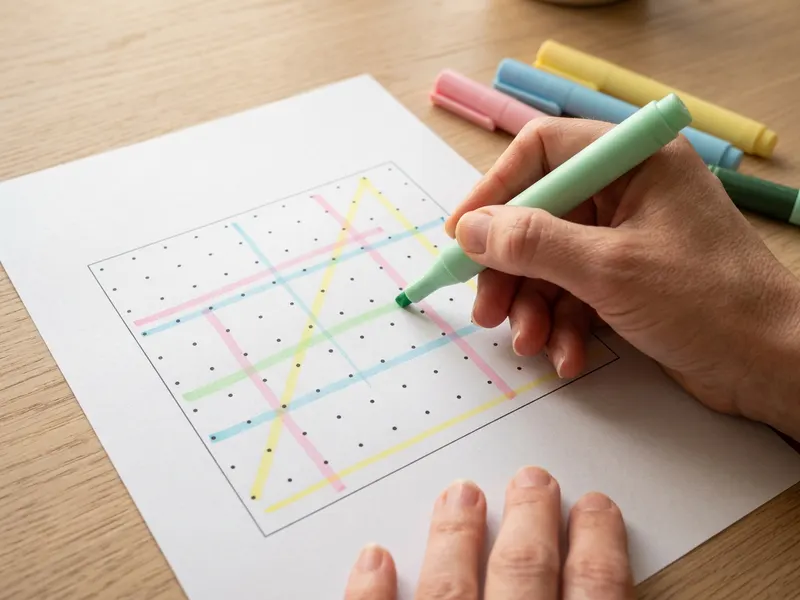 Zebra Mildliner Highlighters (8 pack)
Color-code the printout of your chart, or mark the key slices in a report.
-
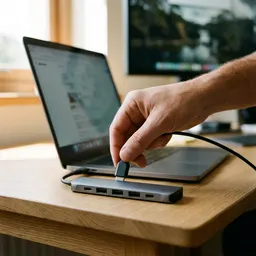 Anker 7-in-1 USB-C Hub
Plug your laptop into a projector or TV to show the chart on a big screen.
-
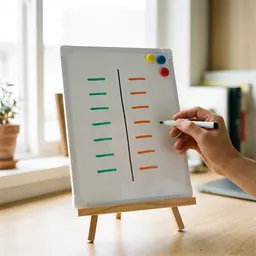 Desktop Magnetic Whiteboard with Markers
Sketch the poll tallies on a whiteboard before you type them in.
Helps keep the tools free. ✨
Images are for illustration only. As an Amazon Associate I earn from qualifying purchases.


